PET/CT CANCER MAPPING
See where the disease is — and measure it.
Ingensia software processes whole-body FDG PET/CT, identifies and outlines disease burden, and turns each case into measurements physicians and researchers can use. That includes tumor volume, radiomics features, and a structured report — with no manual contouring.
Simple workflow
Quantitative features
Structured report
WHAT THE SOFTWARE DOES
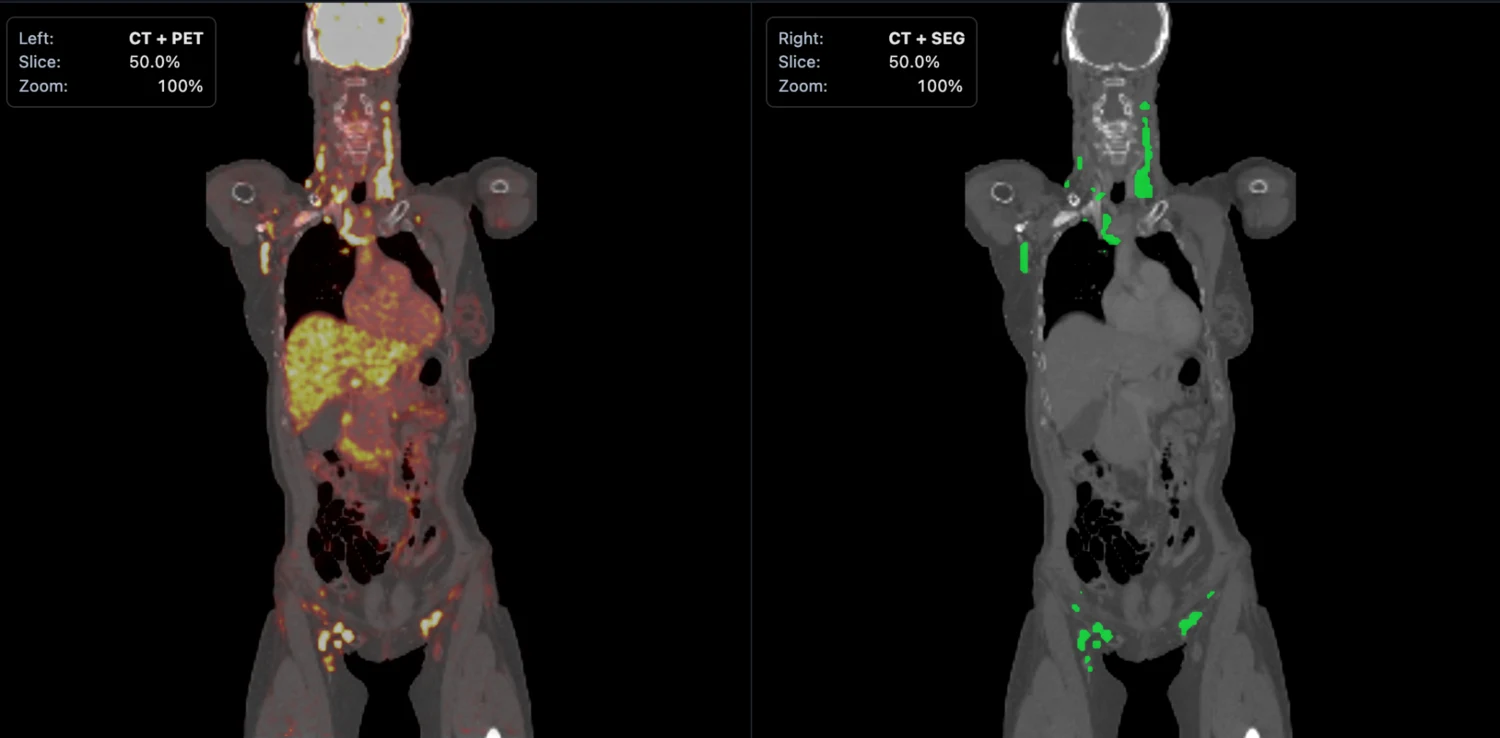
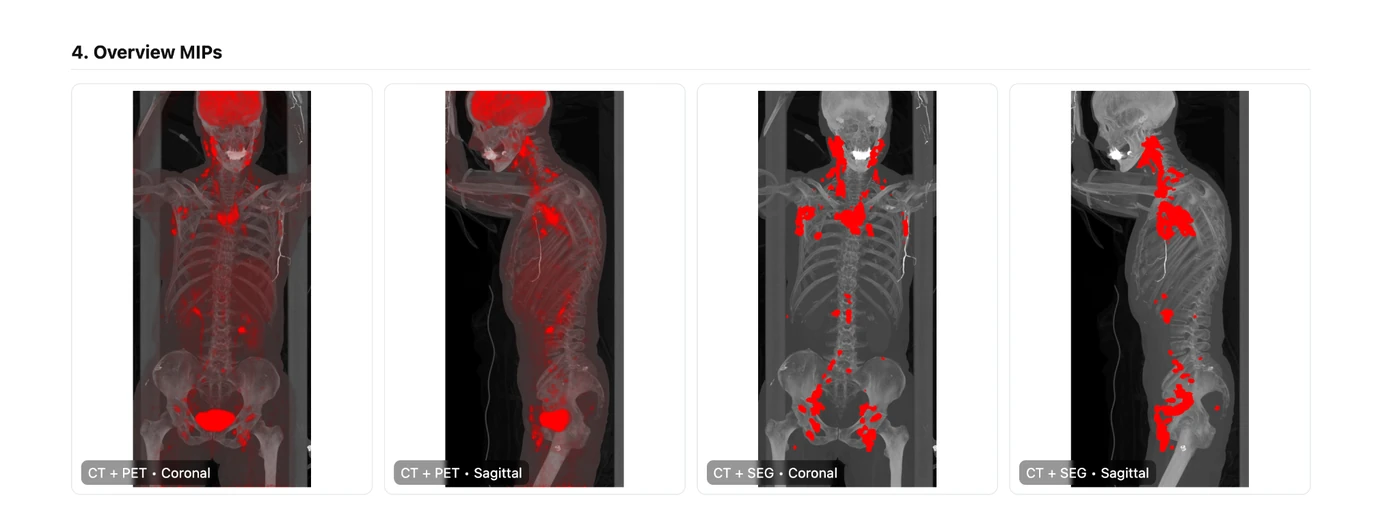
Left: the PET/CT scan.Right: the segmentation mask generated by the software.
The PET/CT image shows the scan with abnormal uptake in context. The segmentation image shows what the model has isolated as disease. Once that mask is created, the rest of the pipeline can measure tumor burden and export structured case-level results automatically.
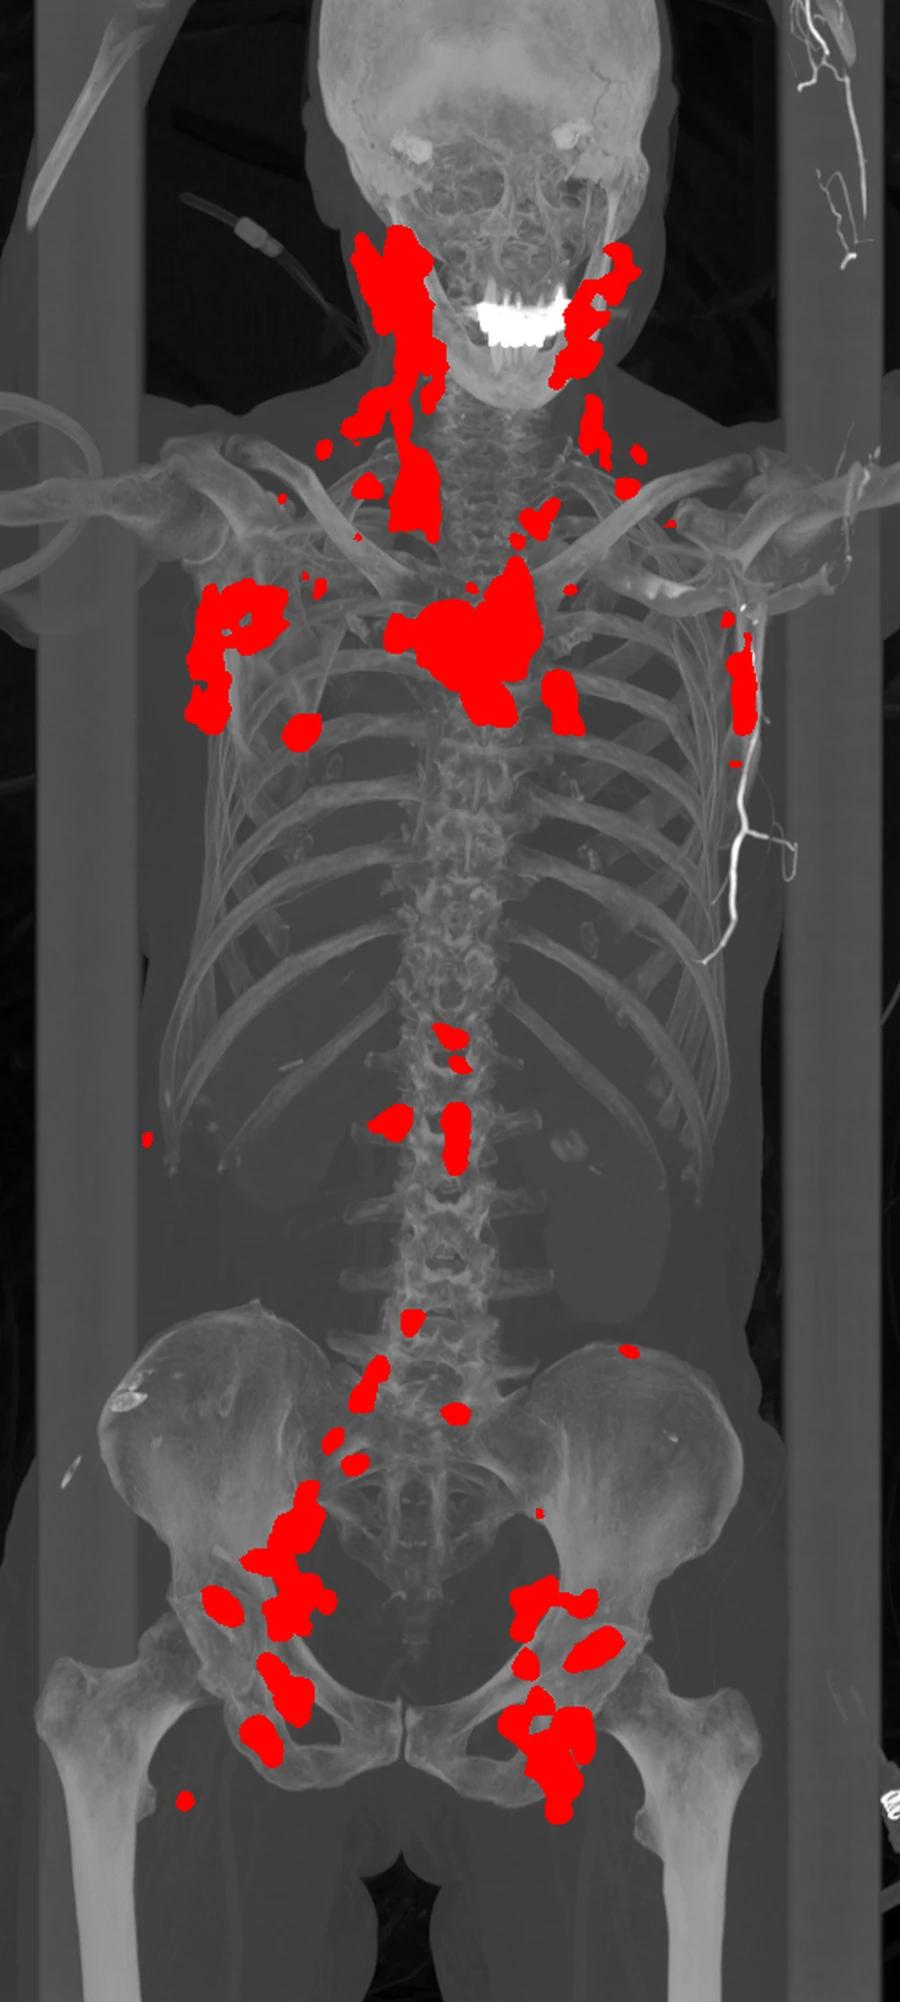
PET/CT input shows where abnormal uptake appears
Segmentation output shows what the model marks as disease
10 cases
blinded DLBCL hold-out used for the benchmark against the next-best open-source comparator
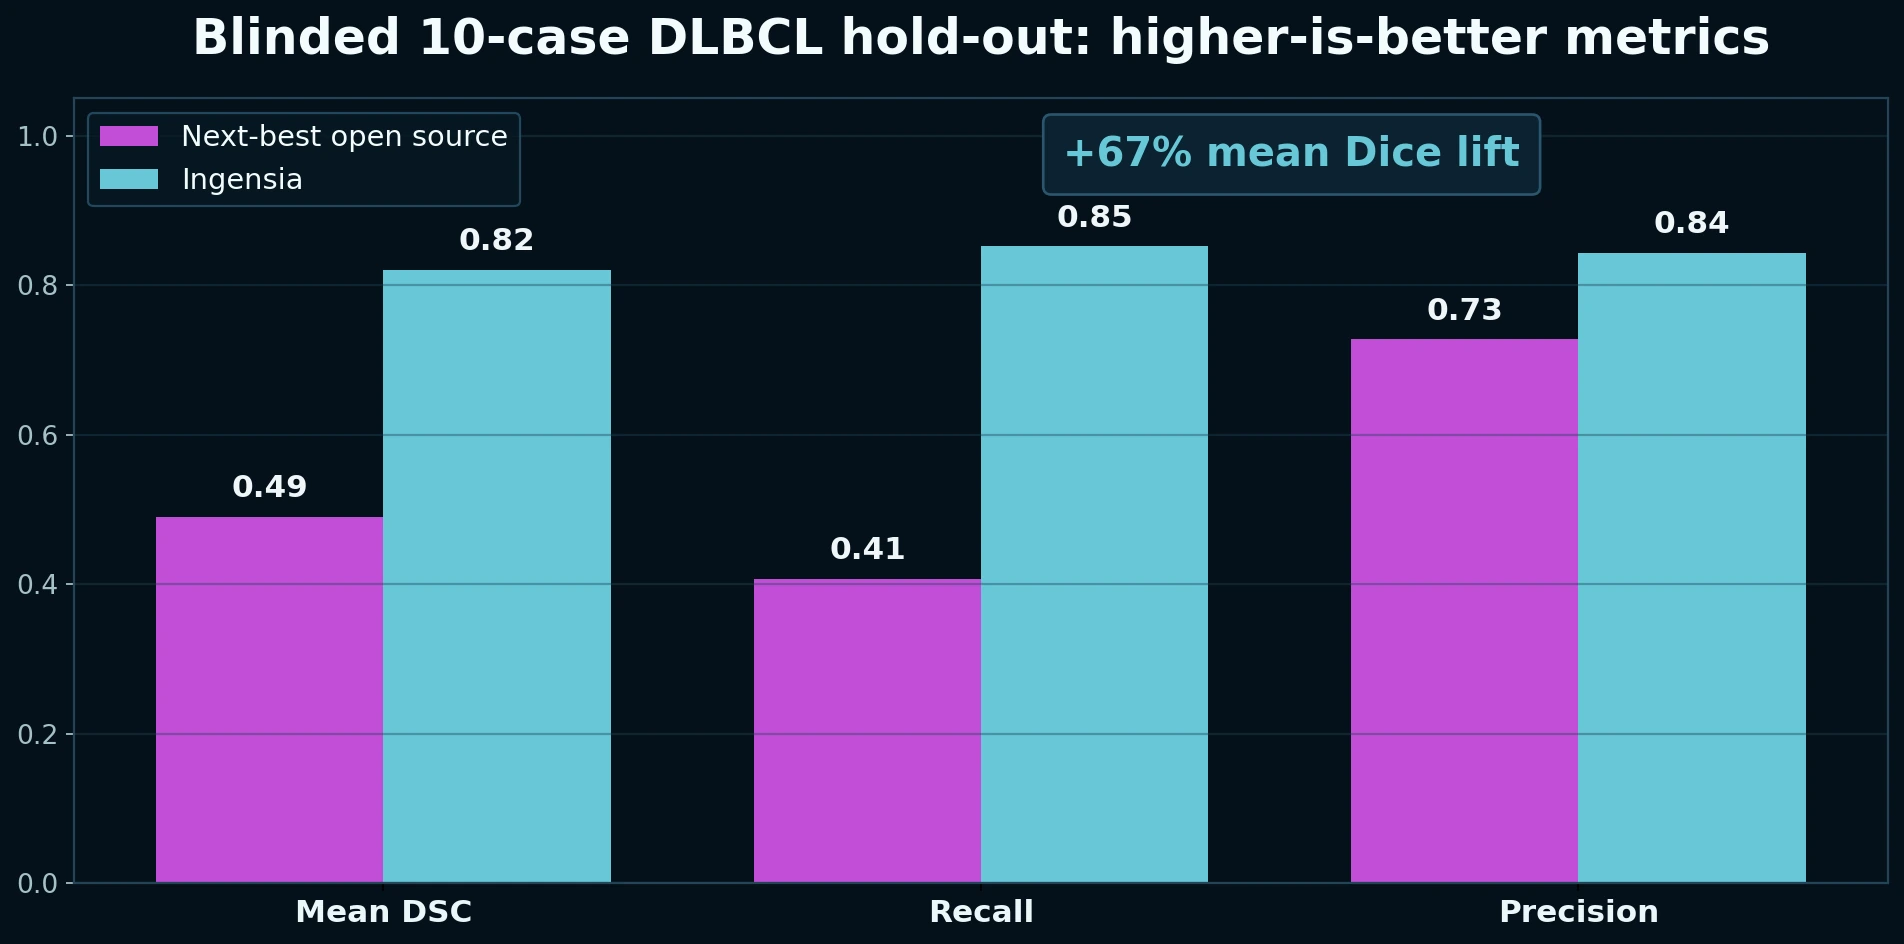
+67%
Higher mean Dice score versus the next-best open-source lymphoma PET/CT model in the blinded comparison.
15 minutes
On average, one PET/CT study can be fully analyzed, segmented, converted into downstream radiomics features, and packaged into a comprehensive report in only 15 minutes.
REAL SAMPLE REPORT
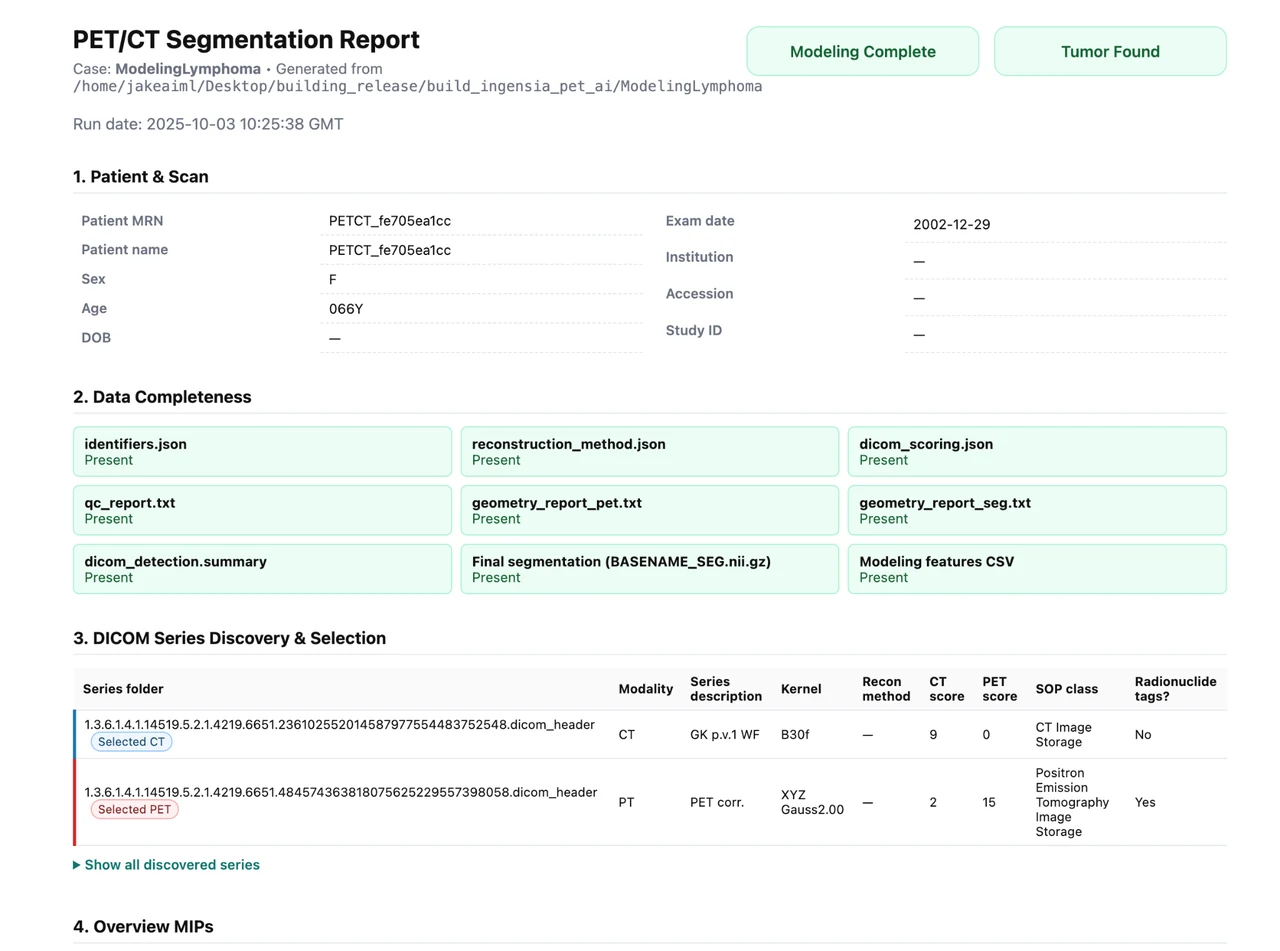
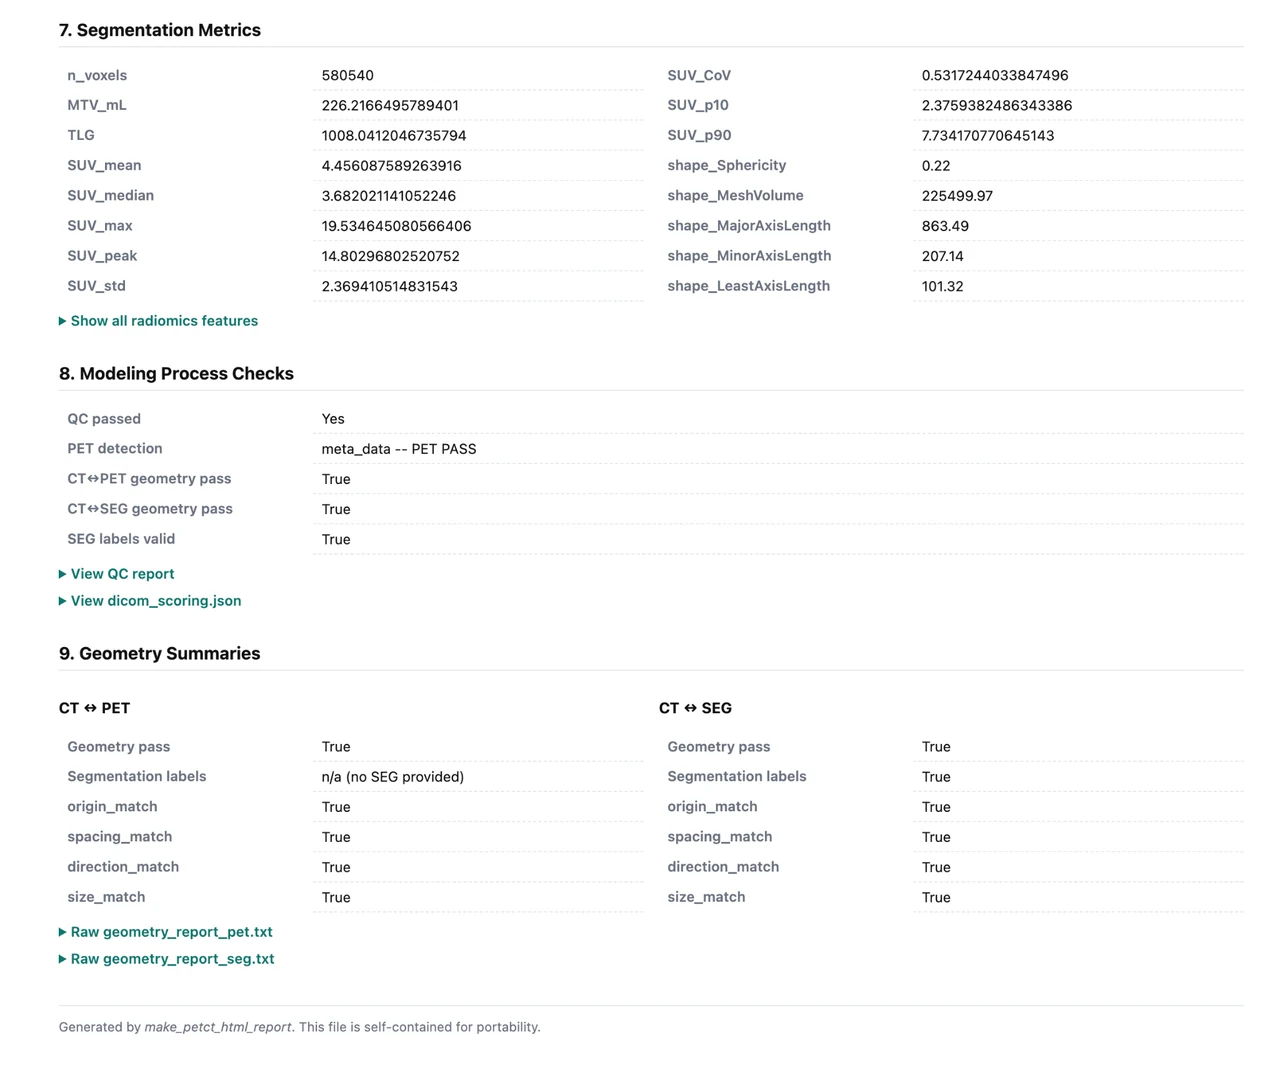
See the actual report generatedfrom one processed PET/CT case
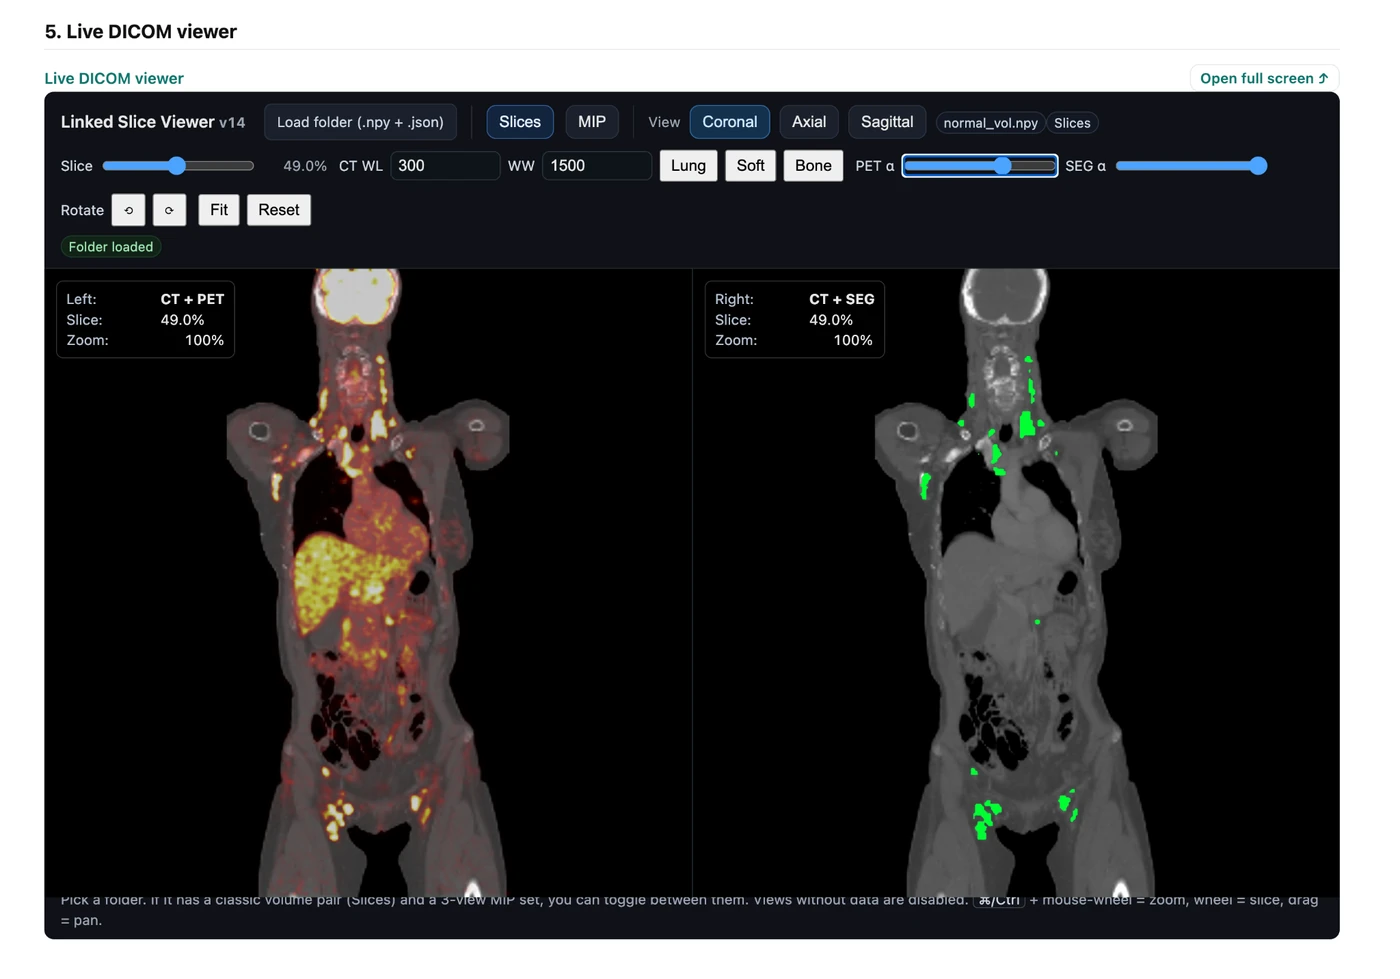
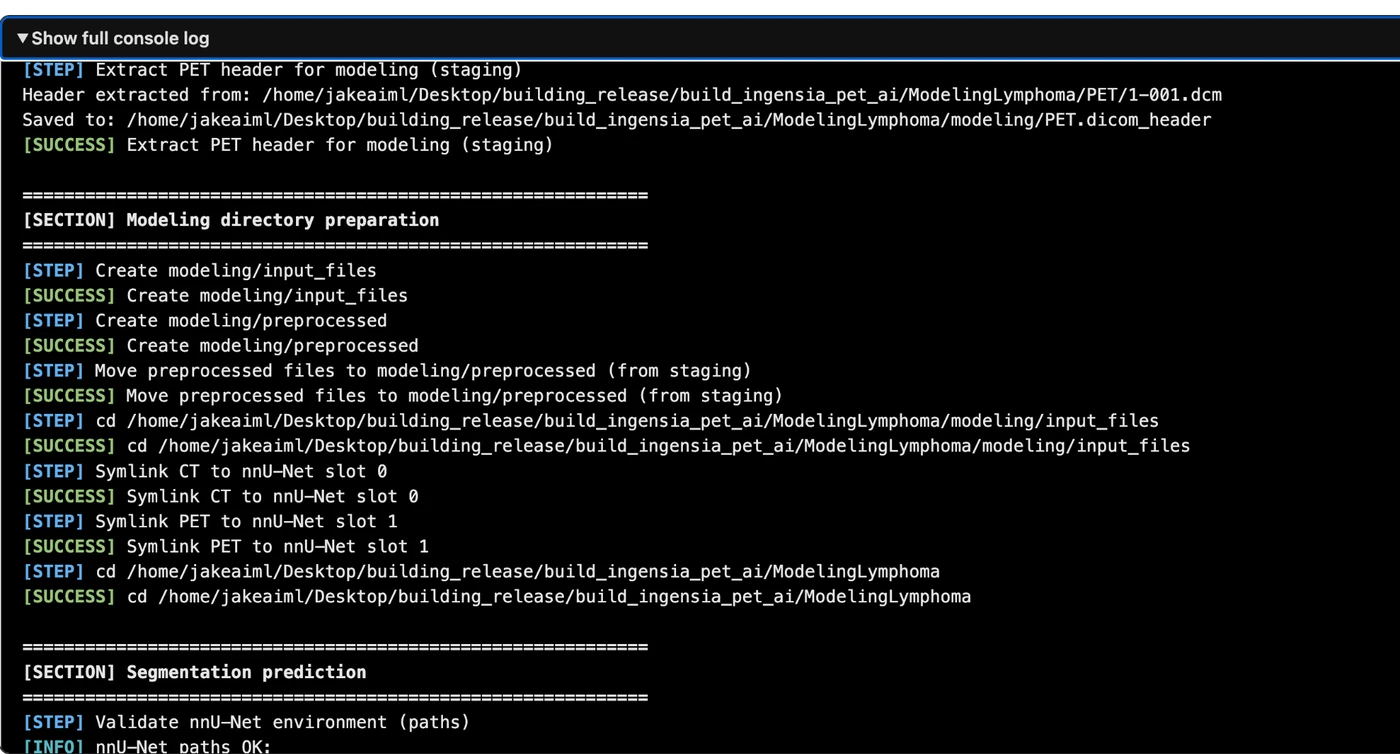
This is the real HTML output from a single DLBCL PET/CT case processed by the pipeline. It is not a mockup. The live page below includes automated input selection, overview MIPs, the linked DICOM viewer, modeling visuals, quantitative outputs, QC checks, and the full console log.
Real HTML report
Interactive viewer included
QC + radiomics + audit trail
ABOUT THE FOUNDER
Built by a clinical oncologist with deep AI roots
Ingensia was founded by Jacob Shreve, MD, MS, a physician–computer scientist whose career spans clinical oncology, bioinformatics, and translational artificial intelligence. The company reflects the same philosophy that has shaped his work: use advanced models where they solve real problems, validate them rigorously, and make them useful inside real clinical environments.
Professional biography
Dr. Shreve is a clinical oncologist and physician–computer scientist whose work sits at the intersection of cancer care, medical imaging, computer vision, and translational AI. He began his career in computational science and bioinformatics before moving into medicine to bring advanced analytics closer to patient care.
His postgraduate medical training includes residency at Cleveland Clinic and fellowship at Mayo Clinic. At Mayo Clinic, he founded the Hematology AI Group and helped spearhead some of the institution’s earlier practical uses of AI in hematology and oncology. That combination of technical depth and frontline clinical experience now defines Ingensia’s approach to PET/CT imaging AI: rigorous, practical, and built for the realities of real-world oncology data.
The result is a clinician-led company with a deliberately grounded style. The emphasis is not novelty for its own sake, but robust segmentation quality, transparent outputs, radiomics that can be inspected and exported, and tools that are genuinely useful for collaborating investigators and clinical teams.
Long-form biography, selected publications, invited talks, and research background.
Clinical training
Residency at Cleveland Clinic and hematology/oncology fellowship at Mayo Clinic anchor the platform in the realities of oncology imaging, staging, and treatment response assessment.
Mayo Clinic AI leadership
At Mayo Clinic, Dr. Shreve founded the Hematology AI Group and helped move early AI work from theory into usable hematology and oncology research workflows.
Technical foundation
Software development, bioinformatics, computer vision, and imaging analytics support end-to-end pipeline design from DICOM ingestion through segmentation, radiomics, and export.
CORE EXPERTISE
What the platform actually does
This redesign keeps the site centered on Ingensia’s strongest differentiator: high-value PET/CT computer vision and the analysis pipeline that follows it.
Automated PET/CT lesion segmentation
Whole-body segmentation of FDG-avid disease with disease-burden outputs designed for practical use in DLBCL and related hematologic malignancies.
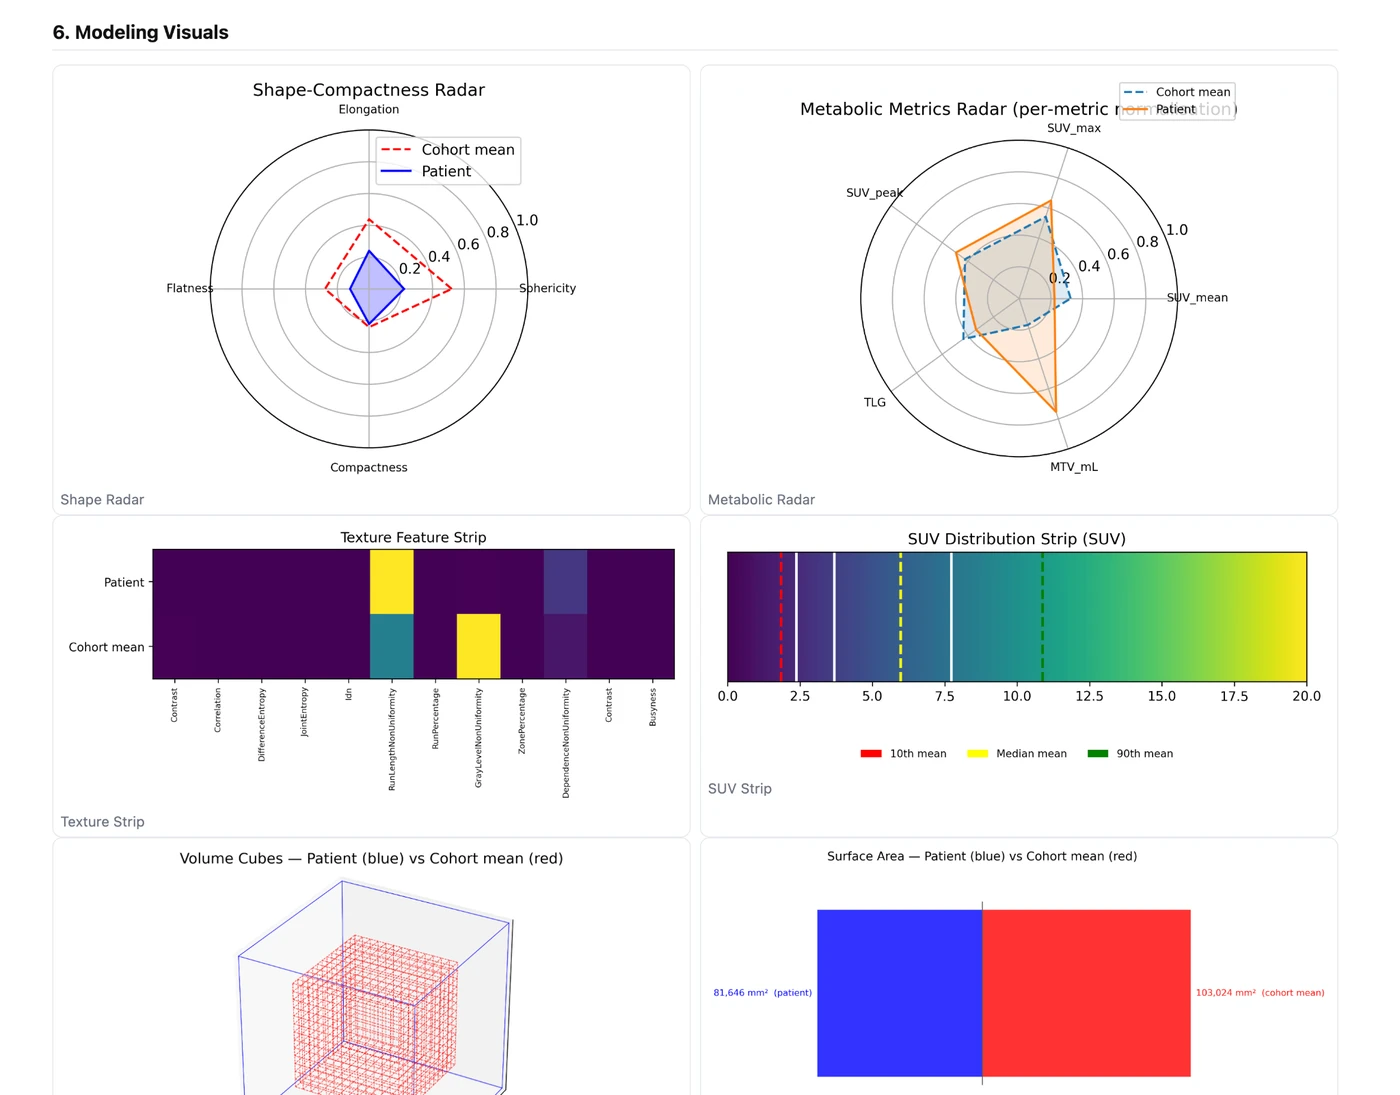
Radiomics at scale
Extraction of tumor shape, intensity, surface, texture, and burden features after segmentation, enabling standardized imaging biomarker generation per scan.
Exploratory machine-learning workflows
Integration of radiomics with clinical and laboratory variables for risk stratification, response modeling, survival analysis, and biologic correlation studies.
DICOM-aware engineering
Robust CT/PET series detection, reconstruction-aware selection, resampling, QC, and reporting so the pipeline is usable on real clinical imaging archives rather than hand-curated toy datasets.
BENCHMARK
Blinded comparison against the next-best open-source lymphoma PET/CT model
For public benchmarking, Ingensia was compared against the next-best open-source lymphoma PET/CT computer-vision baseline we could directly run in this disease space: the French Blanc-Durand/TMTV pipeline1, 2. The goal is simple enough for a clinician and rigorous enough for a technical reviewer: determine whether the software outlines disease more closely to expert reference masks on held-out DLBCL scans.
Better tumor masks make the measurements that follow more trustworthy.
For a non-technical physician, the central question is not the architecture name. It is whether the software actually outlines the disease correctly. In this blinded comparison, Ingensia tracked the expert reference masks much more closely than the next-best open-source lymphoma PET/CT model.
For clinicians
More complete disease outlining means tumor-burden measurements are less likely to miss clinically meaningful volume.
For researchers
Segmentation quality matters upstream because radiomics, SUV metrics, and downstream modeling all depend on that mask.
+67%
higher mean Dice than the next-best open-source lymphoma PET/CT model
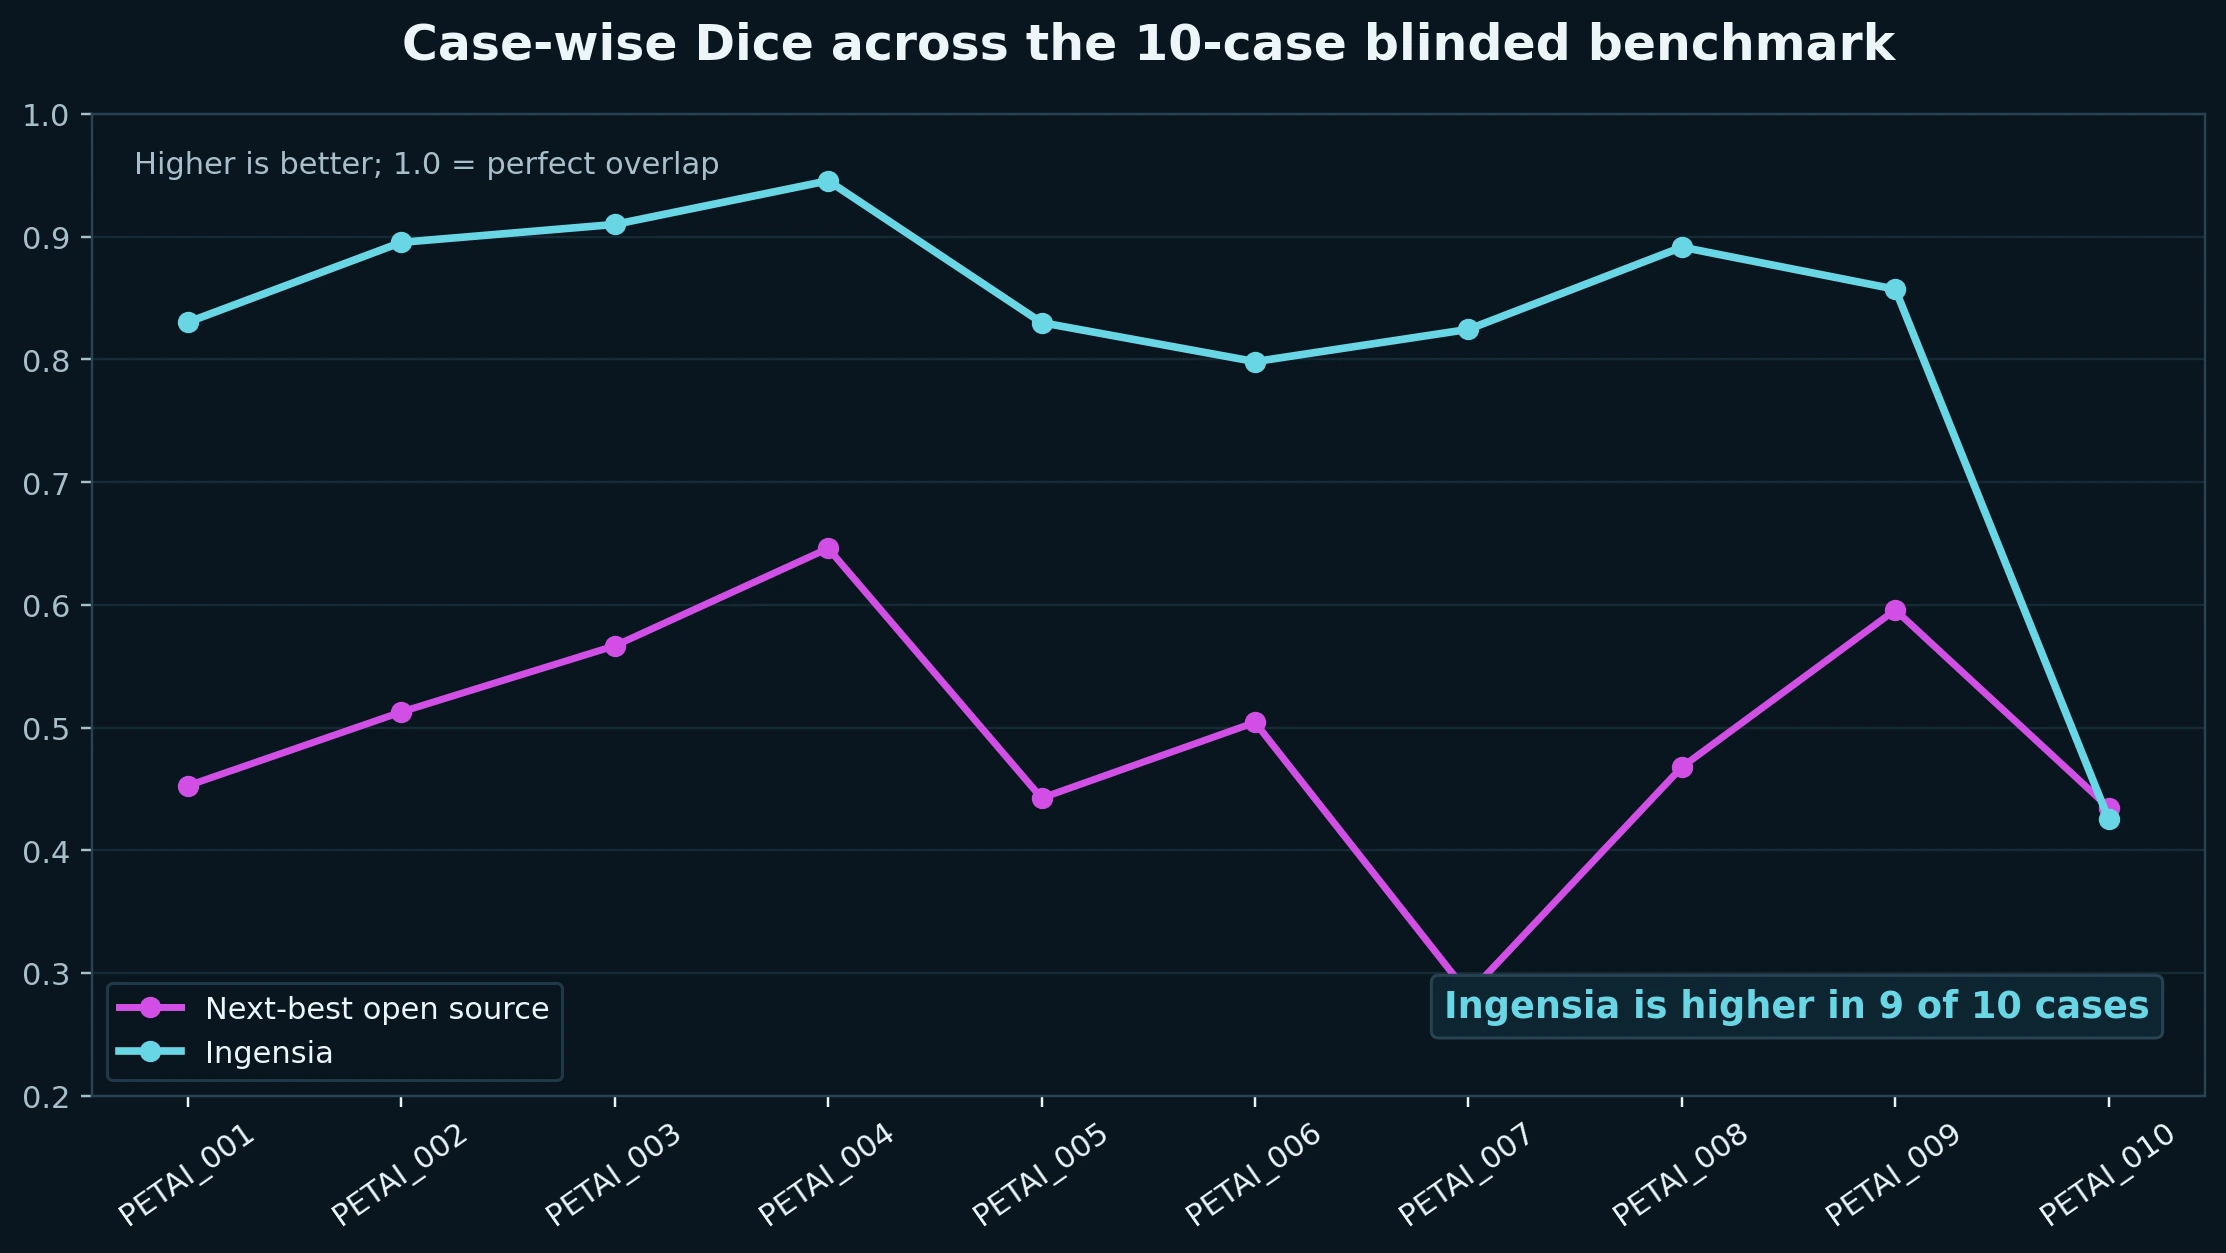
Mean Dice was 0.8208 for Ingensia versus 0.4906 for the next-best open-source comparator on the blinded 10-case DLBCL hold-out, with higher Dice in 9 of 10 cases and materially stronger recall.
0.8208
Ingensia mean DSC
0.4906
Next-best open source DSC
9 / 10
cases with higher Dice
0.8521
Ingensia mean recall
Plain-English readout: Dice is an overlap score between the model mask and the expert reference mask. Higher Dice means the software traced the disease more like the radiologist-verified ground truth.
The next-best open-source baseline
The public comparator used here is the French Blanc-Durand/TMTV lymphoma PET/CT model1, 2. It is a meaningful public benchmark because few open-source lymphoma-specific PET/CT segmentation models exist in this domain.
- Designed for lymphoma lesion segmentation and TMTV-oriented analysis.
- Distributed as a public inference wrapper around the French model.
- Expects user-prepared NIfTI pairs: CT as
patientID_0000and PET aspatientID_0001in SUV2.
What the full Ingensia workflow adds
Ingensia does not stop at a segmentation call. The observable stack handles DICOM normalization, CT/PET series nomination, PET-to-CT-grid harmonization, nnU-Net v2 low-resolution and full-resolution inference, ensembling, postprocessing, QC, radiomics extraction, and packaged reporting5, 6.
- DICOM-aware preprocessing and heuristic series selection are part of the product.
- Dual-branch nnU-Net v2 inference is followed by ensemble and postprocessing.
- Downstream outputs include SUV burden metrics, radiomics, QC artifacts, an HTML report, and an interactive viewer.
Why the benchmark is worth taking seriously
The reference masks come from the FDG-PET-CT-Lesions dataset, where FDG-avid lesions were manually segmented in 3D and reviewed in consensus when needed3, 4. That gives the comparison an open and auditable ground-truth backbone.
Why this is especially useful: the comparator is public, the lesion dataset is public, and the reference masks were radiologist-reviewed. That makes the head-to-head result unusually transparent and easy for outside researchers to inspect.
References
Published work and open-source context behind this benchmark
- Blanc-Durand P, Jégou S, Kanoun S, et al. Fully automatic segmentation of diffuse large B cell lymphoma lesions on 3D FDG-PET/CT for total metabolic tumour volume prediction using a convolutional neural network. European Journal of Nuclear Medicine and Molecular Imaging. 2021;48(5):1362-1370. DOI
- paul-bd/TMTV. Open-source inference wrapper for the Blanc-Durand lymphoma segmentation model, including expected input conventions and public weights instructions. GitHub repository
- Gatidis S, Hepp T, Früh M, et al. A whole-body FDG-PET/CT Dataset with manually annotated Tumor Lesions. Scientific Data. 2022;9:601. DOI
- The Cancer Imaging Archive. FDG-PET-CT-Lesions collection page and data documentation. TCIA collection
- Isensee F, Jaeger PF, Kohl SAA, Petersen J, Maier-Hein KH. nnU-Net: a self-configuring method for deep learning-based biomedical image segmentation. Nature Methods. 2021;18(2):203-211. DOI
- MIC-DKFZ / nnUNet. Official nnU-Net repository and v2 documentation, including 3D configuration families, postprocessing, and the v2 implementation. GitHub repository
SELECTED PUBLICATIONS
Clinical and translational work underlying the platform
The site grounds the offering in concrete disease-focused work instead of generic AI consulting language.
Automated FDG PET/CT radiomics for risk stratification in newly diagnosed diffuse large B-cell lymphoma (DLBCL)
Early demonstration that an automated PET/CT radiomics workflow can be used for risk stratification in newly diagnosed DLBCL.
View referenceArtificial Intelligence Derived Changes between Baseline and Interim FDG-PET/CT Radiomics Features Are Associated with Survival Outcomes in Diffuse Large B-Cell Lymphoma
Deep-learning-based PET/CT radiomics deltas between baseline and interim imaging were linked to survival outcomes and compared with NCCN-IPI.
View referenceDepth of metabolic response at interim PET and survival outcomes among patients with primary refractory or early relapsing diffuse large B-cell lymphoma (DLBCL)
Interim PET metabolic response was studied in the highest-risk DLBCL population: primary refractory and early relapsing disease.
View referenceP921: Artificial intelligence based FDG PET/CT radiomics for risk stratification in newly diagnosed multiple myeloma
Deep-learning segmentation plus radiomics extraction from diagnostic PET/CT, integrated with clinical and marrow variables for risk modeling.
View referenceRadiomics-Based Biomarkers for Risk Stratification in Newly Diagnosed Multiple Myeloma
Automated image segmentation and PET/CT radiomics in 443 myeloma patients with complete R-ISS data yielded a radiomics risk score with discrimination comparable to ISS and R-ISS.
View referenceRadiomics-based identification of high-risk disease in newly diagnosed multiple myeloma
PET/CT-derived tumor volume, density, and heterogeneity were linked to high-risk cytogenetics, marrow burden, response to first-line therapy, and overall survival.
View referenceLET’S BUILD A STUDY OR DEPLOYMENT PLAN
Need automated PET/CT segmentation plus downstream radiomics?
Use this site as the front door for retrospective cohort studies, biomarker discovery, external benchmarking, and custom PET/CT analytics workflows.
Currently licensed for use at
 MD Anderson Cancer Center
 Mayo Clinic Cancer Center